PS ABGK-PS big-gradient logging equipment
Appointment
The PS bi- gradient logging equipment (ABGK-PS) is designed to measure the spontaneous polarization (PS) potential and the difference (gradients) of PS potentials in oil and gas wells.
The equipment is a downhole telemetry system, which includes a probe consisting of 5 electrodes and an electronics unit.
The equipment is designed to work in conjunction with logging stations equipped with a recording system that allows receiving data with the "Manchester 2" code and a constant voltage source.
The equipment provides a measurement of the potential difference between the four electrodes (U1 ... U3, U5); channel PS and the transmission of data by code "Manchester 2".
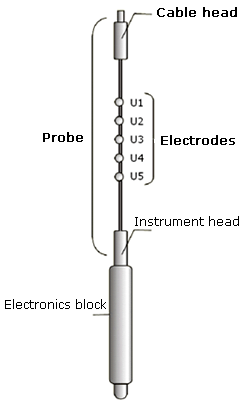
The measurement scheme is presented in the table:
|
Channel number |
Measured signal |
|
K1 |
U1 - U2 |
|
K2 |
U2 - U3 |
|
K3 |
U3 - U5 |
|
K4 |
U5 - U1 |
|
K5 (PS) |
U4 - N |
Specifications
|
Name |
Value |
|
Number of Electrodes (U) |
5 |
|
The distance between the centers of the electrodes, mm |
400 ± 2 |
|
Number of channels (K) |
5 |
|
The number of bits of the output code (sign + mantissa) |
1 + 14 |
|
Input voltage measurement period for all channels, ms |
200 ± 10 |
|
Supply voltage |
80 ± 10 |
|
The consumed current, no more, mA |
fifty |
|
Operating temperature range, ° С |
from +5 to +120 |
|
Working hydrostatic pressure, MPa |
up to 80 |
|
Overall dimensions of the equipment: |
|
|
Mass of equipment, not more than, kg |
40 |
Quality control and charting
Quality control of PS potential diagrams and PS potential gradients.
The quality control of the diagrams recorded by the PS bi - gradient logging equipment provides for:
- Comparison of the main and repeated records. The relative discrepancies of the recorded amplitudes of the PS potential and the gradients of the PS potential should not exceed 5 ±%.
- Due to the fact that the PS potential and PS potential gradients are recorded independently of each other, the quality of the diagrams is also evaluated by the following criteria (Fig. 1):
- a) the inflection points of the PS curve must correspond to the extrema of the PS potential gradient curves, and sandstones correspond the transition from minimum to maximum, and clay on the contrary - from maximum to minimum;
- b) vertical “straight” sections should be observed against powerful homogeneous clay strata (Fig. 1), for the PS potential curve corresponding to the maximum value for a given section of the section, for each PS potential gradient curve to approximately the average between the minimum and maximum values.
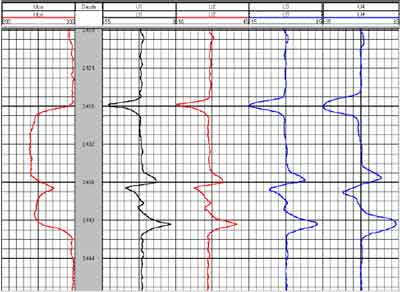
Fig. 1. Display of recorded curves on the monitor screen of the logging station.
- Distortions of the PS potential curve caused by the sliding of the “clay line” should not exceed 20 ±% of the maximum possible PS amplitude for the rocks of the studied interval.
- The number of digital recording failures in the study interval should not exceed two per 100 data recording points.
- Requirements for the registration of magnetic marks must satisfy the requirements of the control and interpretation service of the geophysical enterprise adopted for the GIS complex.
In the KIP, the evaluation of the quality of the PS potential curve can be carried out programmatically using the procedure for reconstructing the PS potential curve from the PS potential gradient. This procedure is attractive in that the measured potential gradient of the PS is practically not affected by external potentials and, therefore, the restored potential of the PS can be taken as true when assessing the quality of the measured potential of PS / 6 /.
Hard Copy Design
The title of the hard copy must contain the following data:
- name of the subsoil user and the producer of the work;
- date of measurements and information about the object of study: the name of the field, the number and category of the well, its altitude, the interval of the investigated depths, the purpose of the research (intermediate, final, reference);
- type and properties (density, viscosity, mineralization) of the washing liquid, the presence of chemical additives and weighting agents in the liquid;
- types and numbers of logging hoist and laboratory (registrar), information about the geophysical cable - its type, length, prices of control and last magnetic marks;
- instrument number and date of metrological verification;
- position of the depth reference point;
- quantization step and recording speed;
- last name of the head or logging operator.
Hard copies of the measurement results are presented on a linear scale in the track T1 (PS potential) and tracks T2, T3, T4, T5 ( PS potential gradients ). The scale of the curves is selected from row 25; 12.5; 5 and 2.5 mV / cm so that they occupy the central part of their track within 80% of its width. The output of hard copies is carried out on a roll paper printer type Printrex .
|
T 1 |
Depth column |
T2 |
T3 |
T4 |
T5 |
|
4 cm |
2 cm |
4 cm |
4 cm |
4 cm |
4 cm |
Fig. 2. Recommended placement of the curves on the hard copy and the width of the tracks for each curve.
Pre-processing and interpretation of charts
bigradientnogo logging PS
Preliminary processing of diagrams recorded by the PS bi - gradient logging equipment (hereinafter, ABGK-PS) is as follows:
- The ABGK-PS curves are aligned with magnetic marks taking into account the price of the first mark.
- The vertical sections of the PS potential gradient curves are selected (Fig. 1), corresponding to thick clays or powerful homogeneous sandstones, and the PS potential gradient curves are shifted horizontally so that they correspond to “zero” values of the PS potential gradient (Fig. 3) .
- Using the boundary beating program according to the ABGK-PS testimony, draw the boundaries of the strata (Fig. 2) and draw a preliminary conclusion about the lithology of the studied section according to the following criteria: a ) sandstones correspond to the transition of PS potential gradients (from top to bottom in depth) from minimum to maximum ; b) clay - the transition from maximum to minimum.
The potential gradient curves ΔU 1 , ΔU 2 , ΔU 3 , ΔU 4 , as well as the eigenpolarization potential (PS) U of the PS , do not have a zero line, which is associated with the presence of a constant component of the electrode potential at each measuring electrode. Since when measuring the gradients of the PS potential, the electrode potential is measured relative to the adjacent other electrode, the consideration of the DC component present on each of these electrodes can be solved by metrological measurements. The constants obtained as a result of metrological measurements are entered into the registration program for the subsequent adjustment of diagrams during the registration process.
If the required metrological measurements were not carried out, then the curves of potential gradients ΔU 1 , ΔU 2 , ΔU 3 , ΔU 4 obtained as a result of measurements in the pre-treatment program are “planted” against thick clays or sandstones as shown in Fig. 3.
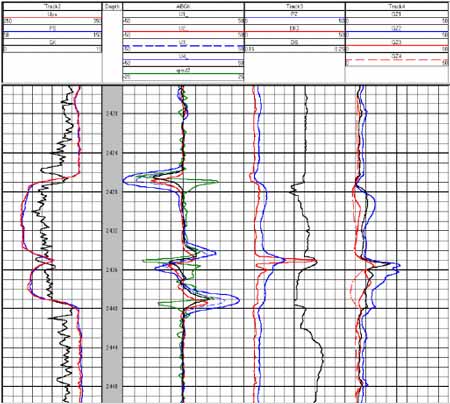
Fig. 3. An example of preliminary processing of the curves recorded by ABGK - PS in the well of one of the fields of LLC LUKOIL - Western Siberia.
In order to correctly imagine what the measured PS potential and PS potential gradient curves look like in the section of the well on a computer using the program for calculating readings of the PS bi - gradient logging equipment in a well crossing a pack of electrically heterogeneous formations with different penetration zone radii, it is possible to construct synthetic PS potential and PS potential gradient. In fig. Figure 4 shows the synthetic curves of the PS potential and the PS potential gradient for the section of the section shown in Fig. 3 (the PS potential curve is shown in red, and the PS potential gradient in black).
To calculate the synthetic curves on the results of automated interpretation program elektrometodov ECARE were obtained electrical and geometric parameters of formations - collectors represented in Fig.3. The interpretation data are given in the table.
|
No. |
Interval, m |
h , m |
ρ ZP |
ρ P |
D RFP / d C |
|
1 |
2426.7 - 2434.8 |
8.1 |
21.6 |
4,5 |
2 |
|
2 |
2435.5 - 2437.1 |
1,6 |
20.1 |
3.8 |
4,5 |
|
3 |
2437.6 - 2439.3 |
1.7 |
13,4 |
3.4 |
4.3 |
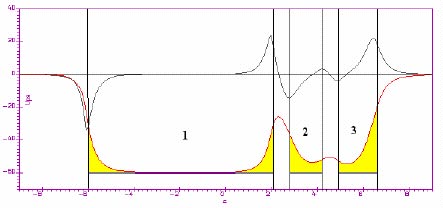
Fig. 4. Synthetic curves of the PS potential and PS potential gradient for the section of the section shown in Fig. 3 (the curves are given to the “clay line”, that is, set to zero). The red curve shows the PS potential curve, and the black one shows the PS potential gradient.
In fig. Figure 5 shows the synthetic curves of the PS potential and PS potential gradient constructed for a thin-layered pack of formations with the following formation parameters:
1) h = 1 m, E PS = 100 (mV), ρ ЗП = 15 ( Ohm.m ), ρ П = 7 ( Ohm.m ), D RFP / d C = 5; 2) h = 0.8 m, E PS = 100 (mV), ρ ЗП = 21 ( Ohm.m ), ρ П = 14 ( Ohm.m ), D ЗП / d C = 5; 3) h = 0.4 m, E PS = 100 (mV), ρ ЗП = 21 ( Ohm.m ), ρ П = 14 ( Ohm.m ), D ЗП / d C = 5. The resistivity of clay is 5 ( Ohm. m ).
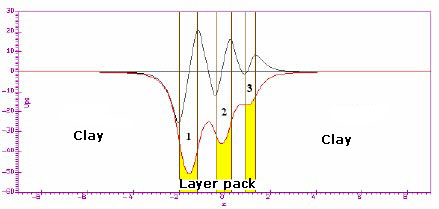
Fig. 5. Synthetic curves of the PS potential and the difference (gradient) of PS potentials in a thin-stratified pack of layers (the curves are given to the “clay line”, that is, set to zero):
4) h = 1 m, E PS = 100 (mV), ρ ЗП = 15 ( Ohm.m ), ρ П = 7 ( Ohm.m ), D ЗП / d C = 5; 5) h = 0.8 m, E PS = 100 (mV), ρ ЗП = 21 ( Ohm.m ), ρ П = 14 ( Ohm.m ), D ЗП / d C = 5; 6) h = 0.4 m, E PS = 100 (mV), ρ ЗП = 21 ( Ohm.m ), ρ П = 14 ( Ohm.m ), D ЗП / d C = 5.
The red curve shows the PS potential curve, and the black one shows the PS potential gradient.
If necessary, a curve of the second derivative of the PS potential can be obtained from two curves of PS potential gradients, according to which control over the lithological dissection of the studied section can be carried out.
Thus, using the LitLog program , lithological dissection of the studied section is performed according to the curves of the PS potential gradients and the curve of the second derivative of the PS potential (Fig. 6); moreover, only the curves of the PS potential gradient can be used to separate the section into the well operatively.
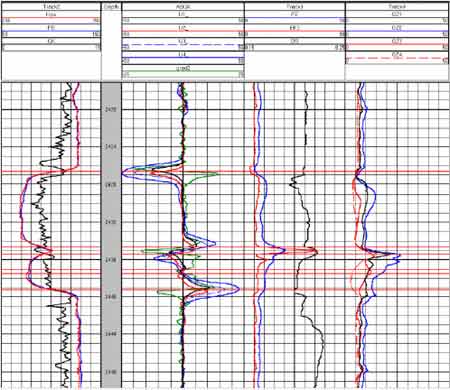
Fig. 6. An example of a section exploded by the LitLog program according to the readings of the PS big - gradient logging equipment.
Ultimately, the processed PS bi-gradient logging curves are input to the ABGK-PS interpretation program and used to evaluate the geometric ( h, D ЗП / d C ) and electrical parameters of reservoirs (static potential E PS and double difference parameter α PS ).
Mnemonics of logs in drawings
PS - PS potential curve (standard complex)
GK - gamma-ray log
Ups - PS potential curve (ABGK-PS)
U1 - PS potential gradient curve, electrode spacing 0.4 m (ABGK-PS)
U2 - PS potential gradient curve , the distance between the electrodes is 0.4 m (ABGK-PS)
U3 is the potential gradient curve of the PS, the distance between the electrodes is 0.8 m (ABGK-PS)
U4 is the gradient curve of the potential of PS, the distance between the electrodes is 1.6 m (ABGK-PS )
grad2 - second derivative curve SS potential (ABGK-PS)
PZ - curve potential - the probe
BK3 - curve three-electrode side arotazha
DS - caliper
GZ1 - curve gradient probe (0.45 m)
GZ2 - curve gradient probe (1.05 m)
GZ3 - curve gradient probe (2.25 m)
GZ4 - curve gradient probe (4.5 m)

